

Solutions · Land & Portfolio
Assets business process · linear infrastructure portfolio
The portfolio is a system of record. The map is how you open it.
National infrastructure landholders do not have a mapping gap. They have a branded portfolio level, plots, buildings, linear strips, leases, disputes, depreciations, work orders and BPOs that refuse to live in a GIS silo while the PMIS runs somewhere else.
Dashboards are drillable. A disputed plot is a fact on the business process — visible on the map, on the asset, in search. Work orders and BPOs sit on that same asset, in the same inbox.
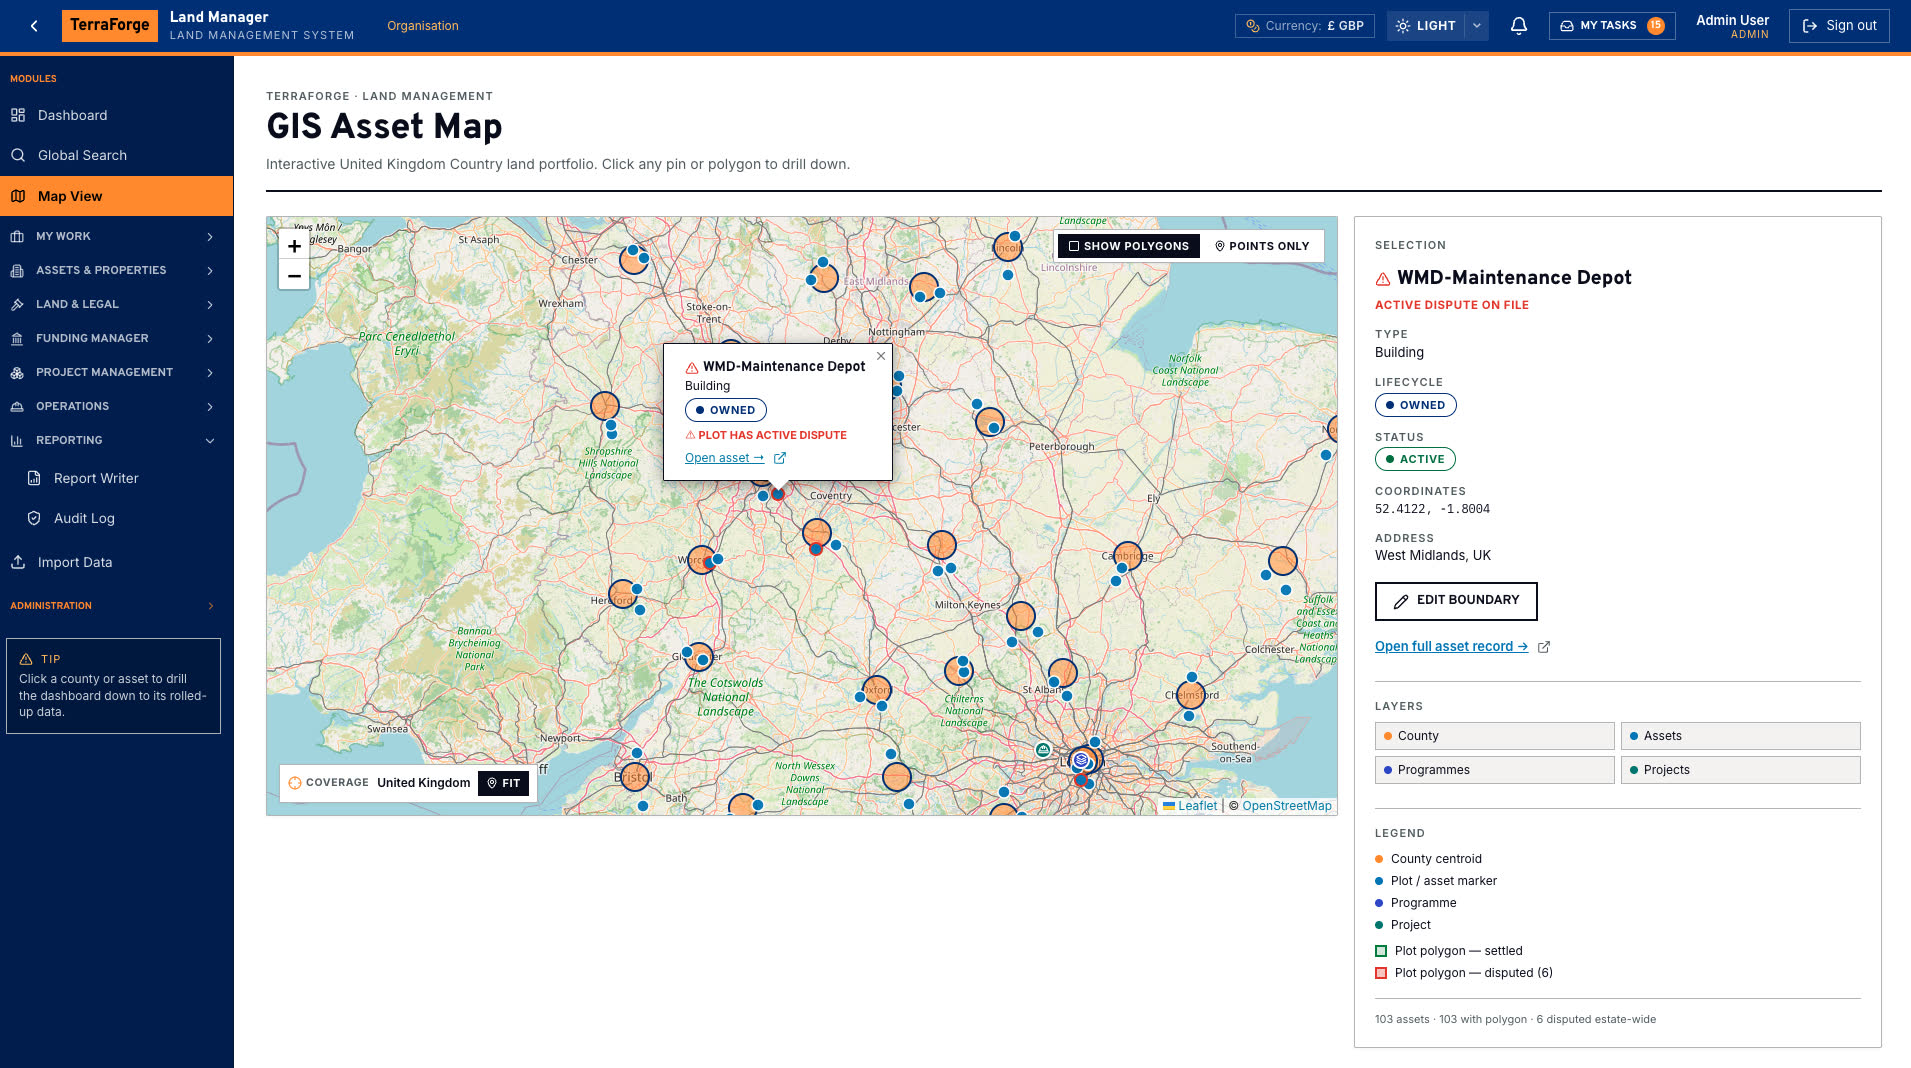
Map View
Not a dumb map — click through to the dispute, the asset, the programme.
GIS without Map View undersells the product. The map is the same records as the PMIS — not a silo. Click a portfolio level or an asset and rolled-up data drills. The same map lives inside Assets and Projects, not only this screen.
Asset detail
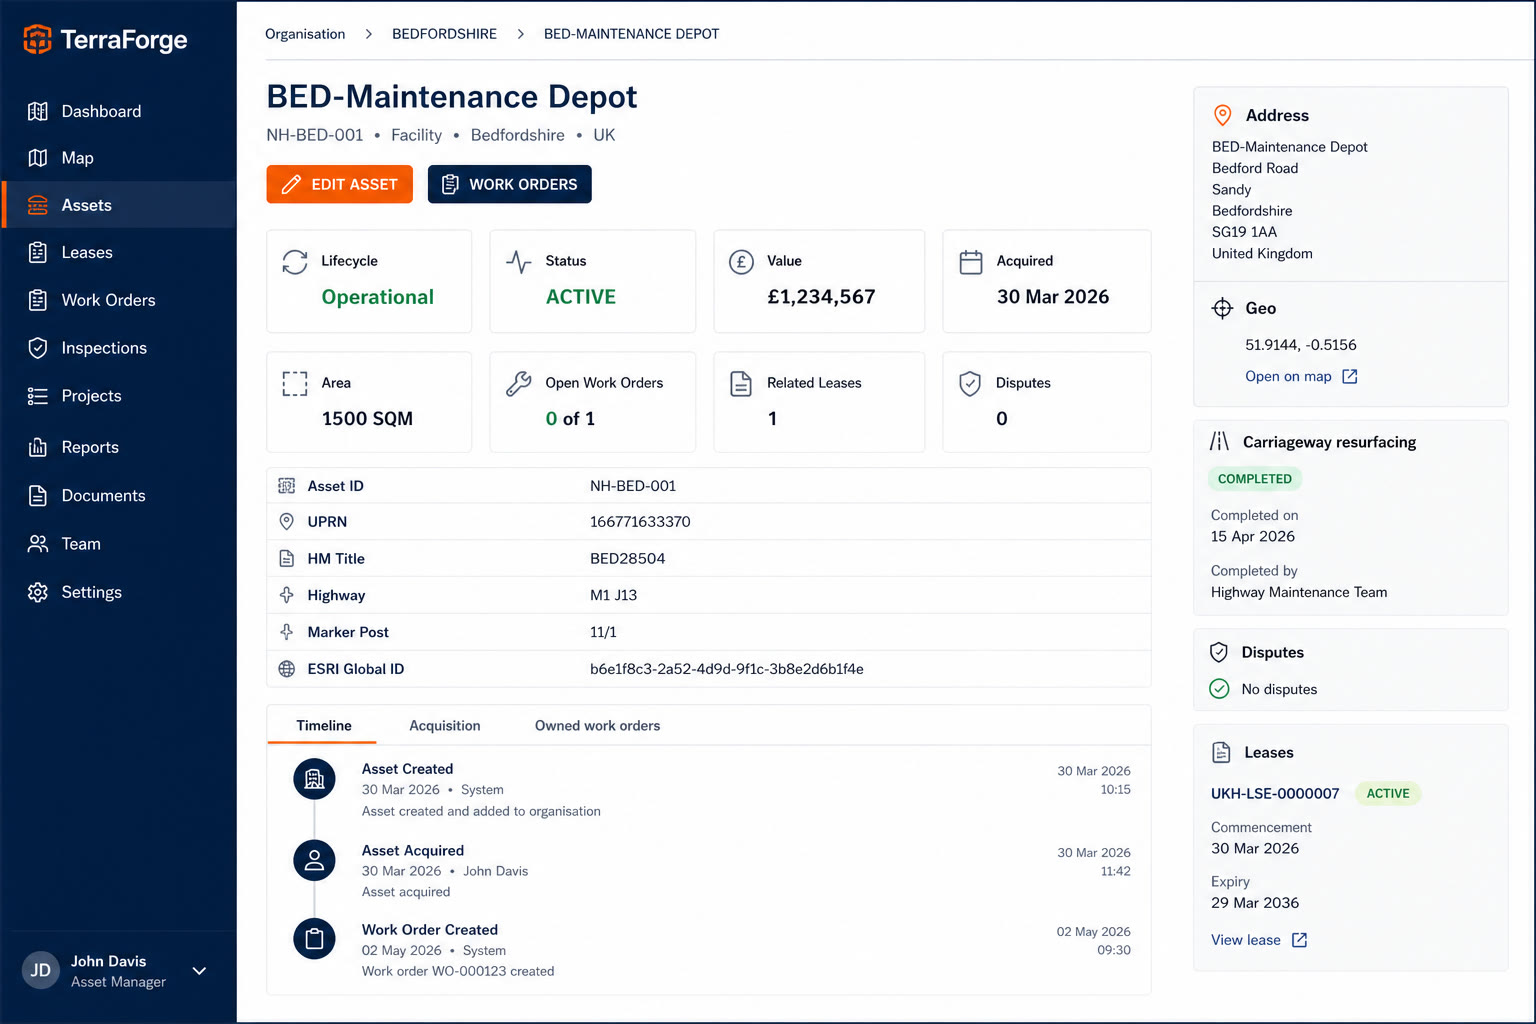
The depot, the verge, the lease — one family.
Dispositions and depreciations sit beside the plot. Route / corridor reference and chainage live on the asset. That is the portfolio the programme already spends against.
What ships
Property, land and legal, operations — one hierarchy.
Property & asset business processes
- Branded portfolio level
- The operator-named layer in the portfolio hierarchy. County in the demo — name it counties, states, campus facilities, zip codes, regions, maintenance areas. Click through to the dashboard underneath.
- Assets
- Plots, buildings, facilities and linear strips — a unique ID you can track and report across the portfolio, plus title and route / corridor reference.
- Asset dispositions
- What left the portfolio, and why, on the same record the map already knows.
- Asset depreciations
- Lifecycle value on the asset, not a finance extract reconciled later.
Land & legal
- Leases
- Occupancy on the plot — counterparties, terms, the land it sits on.
- Lease contacts
- Who to call, held against the lease — not a side address book. The demo can label it Book of Reference for markets that use that term.
- Adverse possession
- Claims on the portfolio with the same audit trail as everything else.
- Disputes
- Active dispute is a fact on the plot — map, business process and dashboard.
- Permitting
- Statutory process on the land, in the same inbox as the rest of the work.
Operations on the portfolio
- Work orders
- Assign, supplier action, asset-manager review, field review — Ball-in-Court on the asset.
- BPOs
- Blanket Purchase Orders / Master Agreements — standing operational orders against the portfolio, not a separate CMMS.
- Portfolio-level work orders
- The same work, rolled to the branded portfolio level the dashboard already drills into. County in the demo.
GIS
- Map View
- Not a dumb map. See disputes, projects, programmes, leased and owned assets at a glance — the pin opens the live business-process record, not a dead popup. Points and polygons on the same portfolio records. The same map lives inside Assets and Projects, not only the standalone screen.
- Polygons
- Settled and disputed plot boundaries on the asset record, not a layer file in another system.
- Re-geocode
- Flagged records get a location without leaving the Assets business process.
Drillable dashboards
- KPI tiles
- Counts, status, value — on Assets, Leases, Work Orders, Disputes. Not a BI project.
- Visual metrics
- Breakdowns and progress on the business process itself. The map and the grid open the same numbers.
- Drill
- Click a portfolio slice or an asset. The dashboard rolls down to that slice. Same widgets. Same numbers.
See it running against your own programme data.
Not a canned demo environment — your business processes, your data.